Risk management
How to Calculate Forex Position Size: Worked Examples
By FX Traders Club Editorial Team · · 12 min read
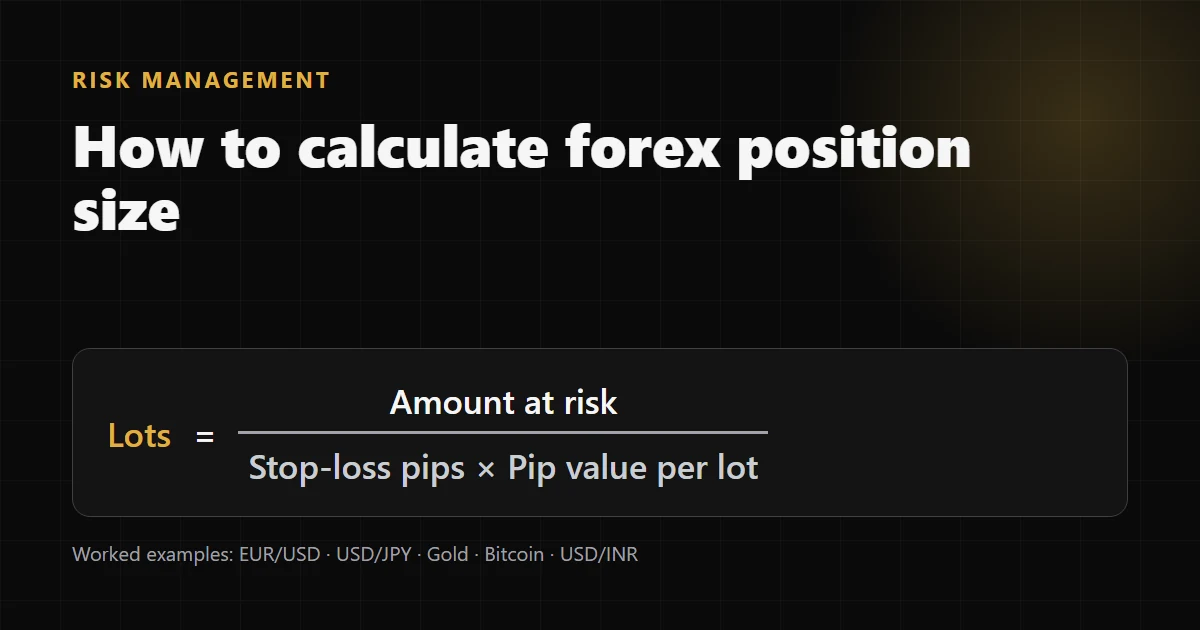
Position size is the number of lots that makes a losing trade cost exactly the amount you decided in advance. You get it from one formula: lots = amount at risk ÷ (stop-loss in pips × pip value per lot). You choose the amount at risk and the stop first, and the lot size comes last. This guide works through the formula for EUR/USD, USD/JPY, gold, bitcoin and exchange-traded USD/INR futures. It covers both US dollar and Indian rupee accounts.
Key takeaways
- Position size = amount at risk ÷ (stop-loss pips × pip value per lot). The lot size is an output, never a starting point.
- On a $10,000 account risking 1% with a 25-pip stop on EUR/USD, the answer is 0.40 lots.
- Gold is where fixed lot sizes hurt most. With the conventions used here, 0.10 lots and a $5 stop on XAU/USD risk $50, which is 5% of a $1,000 account.
- Leverage changes the margin a trade needs. It does not change what you lose when the stop is hit.
- Always round down. Small accounts sometimes can't take a wide stop at any lot size, and that is a reason to skip the trade.
Written and checked by the FX Traders Club editorial team. Every worked example uses the same formula and round-down rule as the free position size calculator, so you can enter the numbers and get the same answers. See how this guide was checked for the method and how to report a correction.
In this guide: the formula · EUR/USD example · pip values by instrument · gold · bitcoin · rupee accounts · USD/INR futures · leverage · losing streaks · mistakes · FAQ
The position size formula
The formula has three inputs, and each answers a separate question.
| Input | Question it answers | Example |
|---|---|---|
| Amount at risk | How much money am I prepared to lose on this trade? | 1% of a $10,000 balance = $100 |
| Stop-loss distance (pips) | How far can price move against me before the idea is wrong? | 25 pips |
| Pip value per lot | What does a one-pip move cost on one standard lot, in my account currency? | $10 on EUR/USD for a USD account |
The formula combines them:
Lots = amount at risk ÷ (stop-loss pips × pip value per lot)
The order matters. Pick the stop where the trade idea is invalidated on the chart, not where it gives you a lot size you like. Moving the stop closer just to trade bigger turns a planned loss into a likely one.
Example 1: EUR/USD on a $10,000 account
- Amount at risk: 1% of $10,000 = $100.
- Stop-loss: 25 pips below the entry.
- Pip value per lot: on EUR/USD a pip is 0.0001 and a standard lot is 100,000 euros, so one pip on one lot = 0.0001 × 100,000 = $10. The pair is quoted in US dollars, which is also the account currency, so no conversion is needed.
- Position size: $100 ÷ (25 × $10) = 0.40 lots.
Check: 0.40 lots × 25 pips × $10 = $100. If the stop is hit, the loss is the planned 1% before spread, commission and slippage.
Pip value per lot by instrument
Pip value depends on two contract details: the size of one pip and the units in one lot. The result comes out in the instrument's quote currency, the second currency in the pair. The table uses the conventions built into the site's calculators.
| Instrument | One pip | Units per lot | Pip value per lot (quote currency) | In a USD account |
|---|---|---|---|---|
| EUR/USD, GBP/USD, AUD/USD | 0.0001 | 100,000 | $10 | $10 |
| USD/JPY | 0.01 | 100,000 | ¥1,000 | about $6.67 at an assumed USD/JPY of 150.00 |
| XAU/USD (gold) | 0.10 | 100 ounces | $10 | $10 |
| BTC/USD (bitcoin) | 1.00 | 1 coin | $1 | $1 |
Keep two cautions in mind when you use this table:
- Brokers differ on metals and crypto. Some count a gold pip as 0.01, and lot sizes for crypto vary a lot. Check the contract specification on your platform before relying on any table, this one included. In MetaTrader that's the symbol's specification window.
- Pairs not quoted in your account currency need a conversion. USD/JPY pays in yen. On a USD account, ¥1,000 per pip per lot is about $6.67 when USD/JPY trades at 150.00, and the dollar value changes as the rate moves. The currency converter does this conversion with European Central Bank reference rates.
Example 2: USD/JPY with a conversion
Working in yen first avoids rounding errors:
- Amount at risk: 1% of $5,000 = $50.
- Stop-loss: 30 pips.
- Loss per lot at the stop: 30 pips × ¥1,000 = ¥30,000, which is ¥30,000 ÷ 150.00 = $200 at the assumed rate.
- Position size: $50 ÷ $200 = 0.25 lots.
If you round the pip value to $6.67 before multiplying, you get $200.10 per lot and 0.2499 lots, which rounds down to 0.24. Rounding late keeps the answer exact.
Gold: why the same lot size risks far more
Gold catches out many beginners, because a "small" lot size isn't small when the stop is a few dollars away.
With the conventions above, a $5.00 move in gold is 50 pips, and each pip is worth $10 per lot. On a $1,000 account:
| Lot size | Loss if a $5 stop is hit | Share of a $1,000 account |
|---|---|---|
| 0.01 | $5 | 0.5% |
| 0.02 | $10 | 1% |
| 0.10 | $50 | 5% |
| 1.00 | $500 | 50% |
To risk 1% ($10) with a $5 stop, the formula gives $10 ÷ (50 × $10) = 0.02 lots. A trader who uses 0.10 lots on every gold trade is risking five times that.
Bitcoin: wide stops, small lots
Bitcoin moves hundreds of dollars in a session, so valid stops are wide and lot sizes are small. With a $600 stop on BTC/USD (600 pips at $1 per pip per lot) and 1% risk on a $2,000 account ($20):
$20 ÷ (600 × $1) = 0.033, which rounds down to 0.03 lots. The real risk is then 0.03 × 600 × $1 = $18, just under the target.
Trading from an Indian rupee account
When the account is in rupees, convert the pip value into rupees before you divide. Take a ₹50,000 account trading EUR/USD, assuming USD/INR at 88.00 to keep the arithmetic clear:
- Amount at risk: 1% of ₹50,000 = ₹500.
- Stop-loss: 20 pips.
- Pip value per lot: $10 × 88.00 = ₹880.
- Position size: ₹500 ÷ (20 × ₹880) = ₹500 ÷ ₹17,600 = 0.028, which rounds down to 0.02 lots.
Rounding down matters here. At 0.02 lots the real risk is 0.02 × 20 × ₹880 = ₹352, or 0.70% of the account, which is below the 1% target rather than above it.
The opposite problem appears with wide stops. The smallest lot on most platforms is 0.01, and 0.01 lots with a 100-pip stop risks 0.01 × 100 × ₹880 = ₹880, or 1.76% of a ₹50,000 account. If even the minimum size breaks your risk limit, the honest answers are a tighter, still-valid stop on a different setup, or no trade.
Exchange-traded USD/INR futures use the same formula
The formula isn't specific to forex lots. Any instrument works once you know what one unit of price movement is worth. For USD/INR futures on the National Stock Exchange of India (NSE), circular NSE/CD/49814 of 4 October 2021 sets one contract at USD 1,000 with a tick size of ₹0.0025 (a quarter of a paisa). One tick is therefore worth 0.0025 × 1,000 = ₹2.50 per contract.
On the same ₹50,000 account risking 1% (₹500), take a stop 10 paise (₹0.10) from entry:
- Loss per contract at the stop: ₹0.10 × 1,000 = ₹100 (40 ticks × ₹2.50).
- Contracts: ₹500 ÷ ₹100 = 5 contracts.
Futures also need margin, and the exchange can change contract terms. Check the current contract specification in the currency derivatives section of nseindia.com, and the margin your broker requires, before trading.
Leverage changes margin, not risk
Leverage decides how much margin your broker blocks to open a position. It doesn't change what you lose at the stop. A 0.40-lot EUR/USD trade with a 25-pip stop loses $100 whether the account runs at 1:30 or 1:500. In the European Union, the European Securities and Markets Authority capped retail leverage at 30:1 for major currency pairs and 20:1 for gold when it restricted CFDs in 2018 (ESMA, 27 March 2018).
High leverage is dangerous for a different reason: it lets you open a position far larger than your risk plan allows. Position sizing is what stops you doing that.
Why risk per trade matters more than any single entry
Most short-term retail traders lose money. In the same 2018 announcement, ESMA said national regulators' analyses showed that 74–89% of retail CFD accounts typically lose money. In India, a SEBI study of equity futures and options found that 93% of more than one crore individual traders lost money between FY22 and FY24 (SEBI press release, September 2024). That study covers equity derivatives, not forex, but it shows how common sustained losses are among retail traders.
Position sizing can't make a strategy profitable. It decides how much damage a bad run does while you find out whether the strategy works. The table below is plain arithmetic: the balance left after 10 losses in a row at a fixed percentage risk, and the gain needed afterwards just to get back to the starting balance.
| Risk per trade | Balance left after 10 straight losses | Gain needed to recover |
|---|---|---|
| 0.5% | 95.1% | 5.1% |
| 1% | 90.4% | 10.6% |
| 2% | 81.7% | 22.4% |
| 5% | 59.9% | 67.0% |
| 10% | 34.9% | 186.8% |
How it's calculated: balance left = (1 − risk)¹⁰; gain needed = 1 ÷ balance left − 1. Each loss is taken as a percentage of the balance at the time.
At 1% risk, a ten-trade losing streak costs under a tenth of the account, and an 11% gain undoes it. At 10% risk, the same streak leaves about a third of the account, and you need a 187% gain, nearly tripling what is left, just to get back to even. A commonly quoted range for risk per trade is 0.5% to 2%, and the position size calculator shows the same range as a hint. There is no correct number for everyone. Lower risk keeps drawdowns smaller while you are still learning.
Common position sizing mistakes
- Choosing the lot size first. "I always trade 0.10" ignores the stop distance, so the real risk changes with every trade.
- Using the same lot size across instruments. 0.10 lots on EUR/USD and on gold are completely different risks.
- Forgetting the conversion. On a rupee account, or on yen-quoted pairs, the pip value isn't $10.
- Rounding up. Round down to the nearest 0.01 lot so the real risk never exceeds the plan.
- Moving the stop after entry. Widening a stop increases the risk you sized for. If the idea is wrong, take the planned loss.
- Ignoring costs and gaps. Spread, commission and swap add to the loss. Price can also jump past a stop around major news, so check the economic calendar before holding through high-impact releases.
- Sizing up because a trade is "guaranteed." No setup is. The U.S. Commodity Futures Trading Commission lists promises that a forex trade is guaranteed to rise, or that forex has no falling market, among the warning signs of forex fraud. Size every trade as if it could lose.
Before your next trade, enter your own balance, risk and stop in the position size calculator and compare its answer with the lot size you were planning to use.
Frequently asked questions
What percentage of my account should I risk per trade?
There is no rule that suits everyone. A commonly quoted range is 0.5% to 2%. The losing-streak table above shows what the choice means: at 1%, ten consecutive losses leave about 90% of the account, while at 5% they leave about 60%.
Does higher leverage let me trade bigger safely?
No. Leverage lowers the margin needed to open a position, but the loss at your stop depends only on lot size, stop distance and pip value. Use the position size formula first, then check that your account has enough margin for it.
What if the calculated size is below the minimum lot?
If the formula gives less than 0.01 lots, the minimum on most platforms, then even the smallest position risks more than your limit at that stop distance. Skip the trade or wait for a setup with a tighter valid stop. Don't round up.
How do I check my numbers after a trade?
Enter the entry and exit prices in the profit calculator to see the pips and profit or loss in your account currency. Then compare the result with the amount you planned to risk.
How this guide was checked
- Arithmetic: every example was recalculated with the position size formula and the round-down-to-0.01-lot rule used by the site's calculator, and the working is shown in each section.
- Assumptions: the exchange rates (150.00 for USD/JPY, 88.00 for USD/INR) are round numbers chosen for illustration, not live quotes. Pip and lot conventions follow the site's calculator settings and differ between brokers.
- Sources: regulator and exchange figures come from the primary documents listed below. No broker, signal service or affiliate source is cited.
- Corrections: if you find an error, email fxtradersclub.in@gmail.com. The site's privacy notice explains what is stored when you contact the team.
Sources
- European Securities and Markets Authority. "ESMA agrees to prohibit binary options and restrict CFDs to protect retail investors." 27 March 2018. esma.europa.eu
- Securities and Exchange Board of India. "Updated SEBI study reveals 93% of individual traders incurred losses in equity F&O between FY22 and FY24." September 2024. sebi.gov.in
- National Stock Exchange of India. Circular NSE/CD/49814 (circular ref. 19/2021), "Introduction of Weekly Futures contracts on USDINR," 4 October 2021. Contract specification: "1 unit denotes 1000 USD"; tick size "0.25 paise or INR 0.0025". Published in the NSE circulars archive at archives.nseindia.com/content/circulars/CD49814.pdf (NSE blocks automated link checks, so it is given as text).
- U.S. Commodity Futures Trading Commission. "Foreign Currency (Forex) Fraud" advisory. cftc.gov
Risk warning: Trading foreign exchange, gold and other leveraged products such as CFDs carries a high level of risk and may not be suitable for all investors. You could lose some or all of your invested capital. This article is education, not financial, investment or tax advice, and past performance is not indicative of future results. Only trade with money you can afford to lose and consider seeking independent advice.